Model incremental lift with a holdout
Estimate extra outcomes using a comparison group.
The scenario
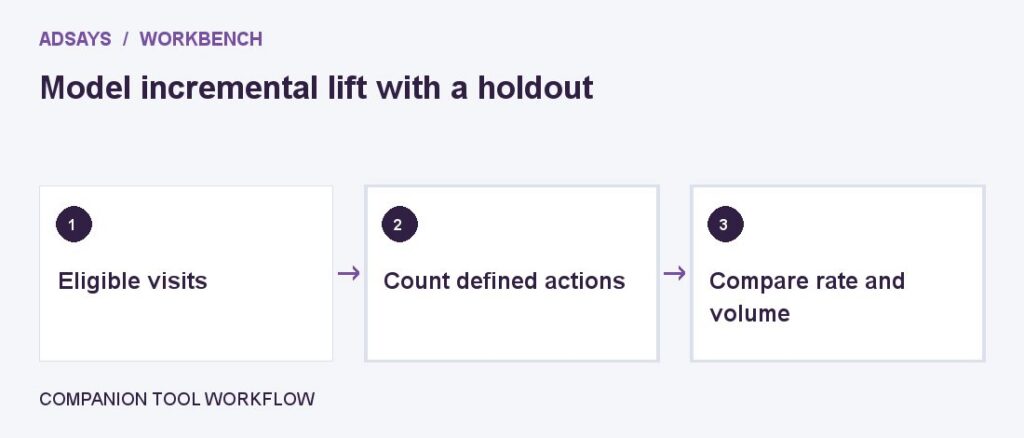
A randomized test has 10,000 people in each arm; exposed users produce 340 orders and holdout users produce 300.
The difference is 40 orders, or 0.4 percentage points; relative lift is about 13.3%. Sampling uncertainty still matters.
Apply it to your own work
Define eligibility and randomize before launch. Check for cross-exposure and compare outcome definitions, then report uncertainty with the lift estimate.
Check the arithmetic before calling a winner
An approximate 95% interval for the difference in this example is −0.09 to +0.89 percentage points, using an independent two-proportion normal approximation. That includes no improvement. The interval assumes comparable independent observations and is illustrative.
If the campaign spent $1,600, the point estimate implies $40 per extra order. Because the estimate is imprecise, treat that figure as a planning input. Verify that the experiment was large enough for the smallest lift that would affect the decision.
What to watch for
Avoid selecting the winning time window after inspecting the data. Document the planned measurement period and any deviations.
Check randomization before interpreting lift
Compare arm size, baseline purchase rates, and whether people in the holdout were exposed through another campaign. If the reported result excludes users who were assigned but never saw an ad, it answers a different question from the assigned-group comparison.
Use additional contribution from extra orders alongside the media cost. A lift can be real and still too small to pay for the campaign. Report the range of plausible outcomes and say whether it spans both profitable and unprofitable scenarios.
Try a related tool
Find the share of eligible visits that completed a defined action. Count at most one conversion per visit for this calculation.