Reconcile analytics and order totals
Find out why two dashboards disagree before choosing a source.
The scenario
Analytics counts 510 orders while the store ledger has 550, including 14 canceled orders.
After excluding cancellations, the store reports 536. The remaining difference may involve consent, event errors, or timezones.
Apply it to your own work
Compare matched date and refund rules, then reconcile a small order-ID sample in a permitted environment. Use the ledger for settled revenue.
What to watch for
Tracking should not be changed to force numbers to match. Some gaps reflect legitimate limits on data collection.
Build a small discrepancy table
Sample orders from the start and end of the period and include a canceled, refunded, and repeated order. For each one, compare transaction identifiers and timestamps in an approved workspace. This can separate timezone differences from missing or duplicate events.
Keep rows for expected exclusions and unresolved gaps. Decide which system supplies financial totals and which supplies behavioral context. If a gap begins after a release, annotate the date rather than treating the historical reports as directly comparable.
Try a related tool
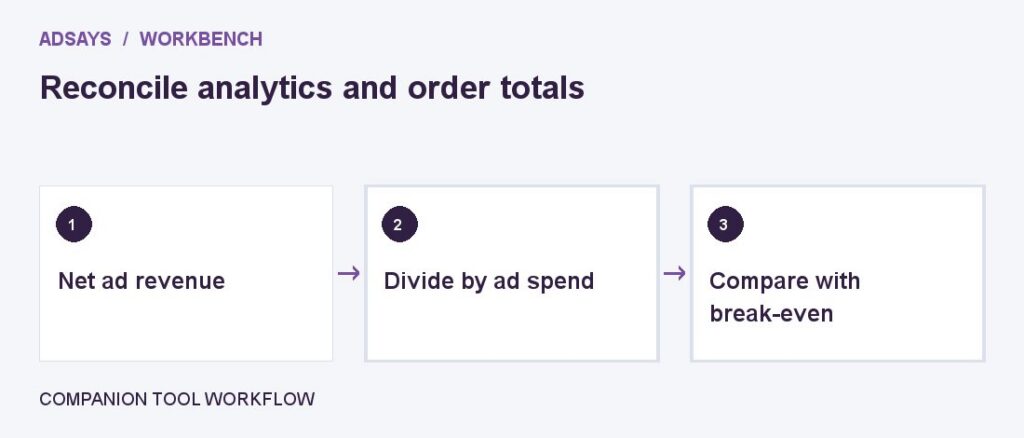
Compare revenue per advertising dollar with the return needed to cover ad spend. Enter net revenue and contribution margin before ads.