Segment marketing data without losing the baseline
Spot meaningful shifts without relying on tiny groups.
The scenario
A newsletter's overall conversion falls from 5% to 4% while desktop and mobile rates each stay steady.
More visitors came from mobile, the lower-converting segment. A mix shift can explain the blended decline even when individual rates hold.
Apply it to your own work
Keep the overall view, then compare device counts and rates for the same periods. Recalculate the overall rate using a fixed mix to isolate the effect.
What to watch for
Rare segments can look extreme by chance. Show counts beside percentages and group categories before drawing conclusions from small samples.
Recalculate at a fixed traffic mix
Suppose desktop converts at 6% and mobile at 2%. A 75% desktop mix yields 5% overall, while a 50% desktop mix yields 4%, even if neither device changes. Apply the original traffic mix to the newer rates to see what remains.
Keep both the real overall outcome and the fixed-mix comparison. The first tells you what the business experienced. The second helps diagnose whether changing who arrived explains the difference.
Try a related tool
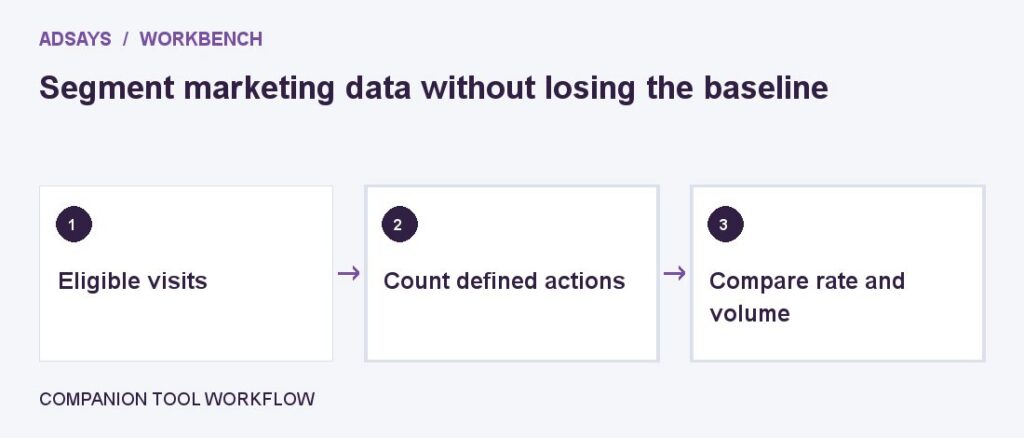
Find the share of eligible visits that completed a defined action. Count at most one conversion per visit for this calculation.