Use cohort tables for repeat purchases
Compare customer groups at equivalent ages.
The scenario
January buyers have 90 days to reorder; March buyers have only 30 days by the reporting date.
Comparing raw repeat totals favors older groups. A 30-day cohort measure gives both groups the same time to act.
Apply it to your own work
Group by first purchase month, choose a repeat window, and mark incomplete cells. Use settled orders and consistent customer matching.
What to watch for
A cohort can change because customer mix changed. Compare channels, offers, and seasonality before attributing differences to retention work.
Give each cohort the same opportunity
Create columns for first purchase month, initial buyers, and repeat buyers by day 30, 60, and 90. Leave immature windows blank rather than filling them with zero.
Compare the 30-day rate within acquisition source before blaming a new onboarding flow. A promotion that attracts one-time gift buyers can lower the blended rate even when regular customers behave the same way. Check repeat contribution as well as count.
Try a related tool
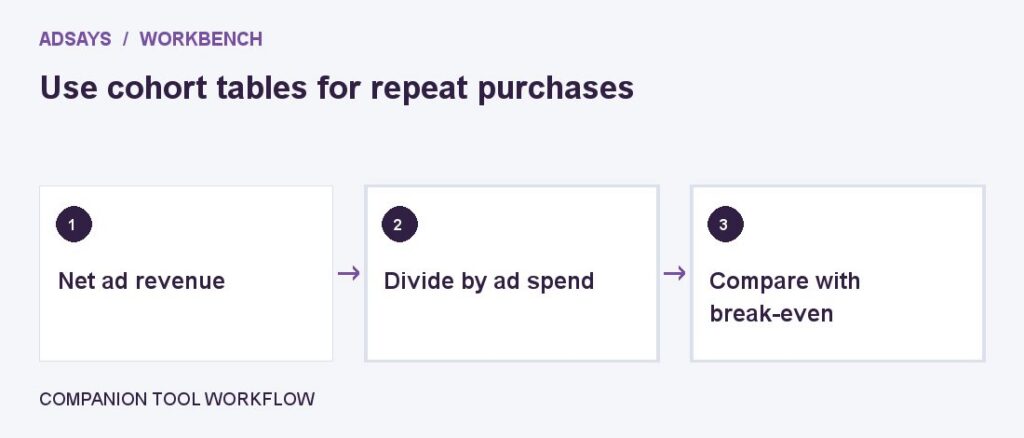
Compare revenue per advertising dollar with the return needed to cover ad spend. Enter net revenue and contribution margin before ads.