Use diagrams to explain a marketing workflow
Choose the picture that answers a specific question.
The scenario
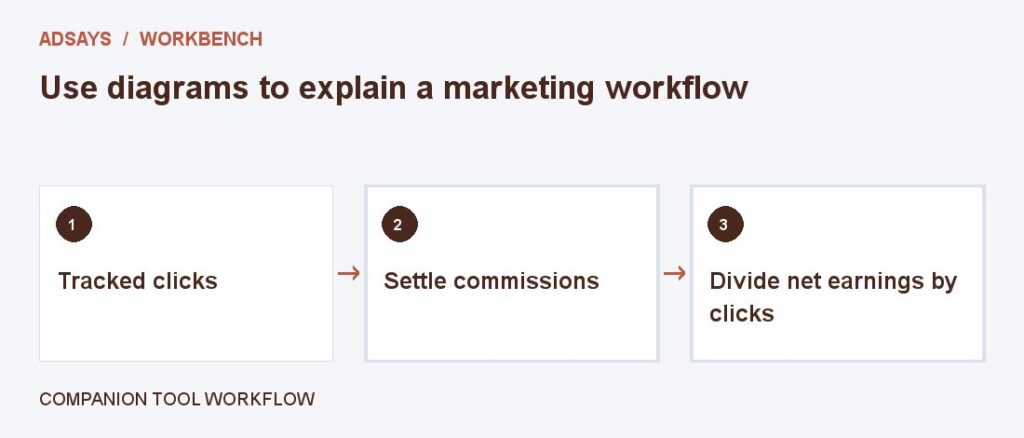
A referral workflow has four stages: click, recorded action, approval, and payout.
A four-step diagram shows why a tracked action is not cash. A chart showing generic upward bars would not communicate that distinction.
Apply it to your own work
Decide what the reader should learn before drawing. Keep labels readable and give the same takeaway in the caption or nearby text.
What to watch for
Color should reinforce the structure rather than carry it alone. The key meaning must remain available without the illustration.
Choose the visual based on the claim
Use a process diagram for referral approval stages and a chart for differences in amounts. If timing matters, label which stages can reverse or be delayed. A label should explain the stage without requiring a color legend.
Repeat the main takeaway in a caption. Check the image at the smallest layout size and include alternative text that describes the relationship shown. Remove visual elements that suggest a trend or comparison the data does not support.
Try a related tool
Measure earnings per tracked referral click after refunds and reversals. Use counts and commissions from the same cohort.