Revenue versus value-based ad optimization
Choose a conversion value that reflects the economic outcome.
The scenario
Two products each sell for $120. One leaves $60 before ads and the other leaves $20.
A revenue signal values the orders equally. A contribution signal would value the first three times as much before fixed costs and repeat behavior.
Apply it to your own work
Map order lines to net revenue and variable costs. Check the distribution of values and count lost identifiers before choosing whether to pass revenue or estimated contribution.
What to watch for
Contribution estimates can go stale when shipping costs or promotions change. Reconcile the value model with accounting on a schedule.
Compare how two values change decisions
Build a spreadsheet with SKU, net revenue, variable costs, and pre-ad contribution. A high-revenue but low-margin product may dominate a revenue-based score. Compare which orders rank highest after replacing revenue with estimated contribution.
Start with a reporting-only comparison before relying on a new value signal. If margins are estimates, sample the assumptions for high-volume items and watch for a channel suddenly receiving lower values solely because its order mix includes a seasonal discount.
Try a related tool
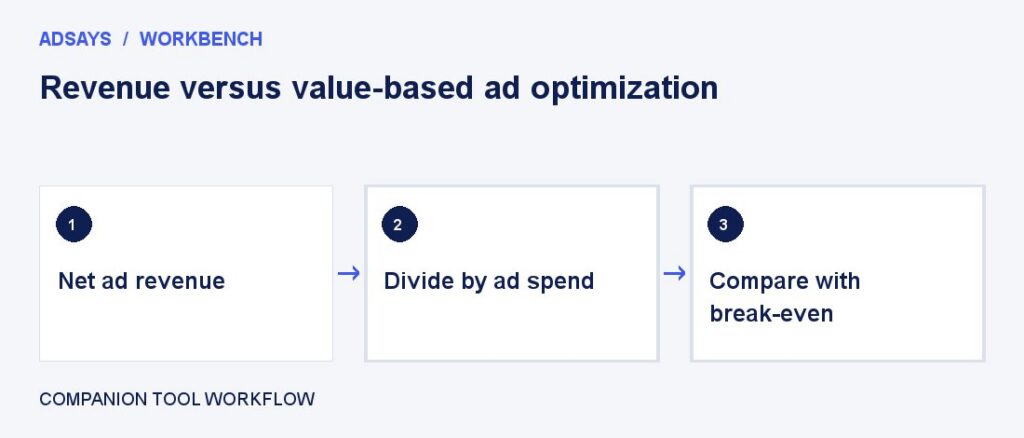
Compare revenue per advertising dollar with the return needed to cover ad spend. Enter net revenue and contribution margin before ads.