Distinguish average order value from order contribution
Explain why a higher basket value may not improve the economics.
Calculate both measures from the same orders
If 80 orders generate $8,000 in net revenue, average order value is $100. If variable order costs total $5,600, contribution is $2,400, or $30 per order. A bigger basket can contain items with thinner margins.
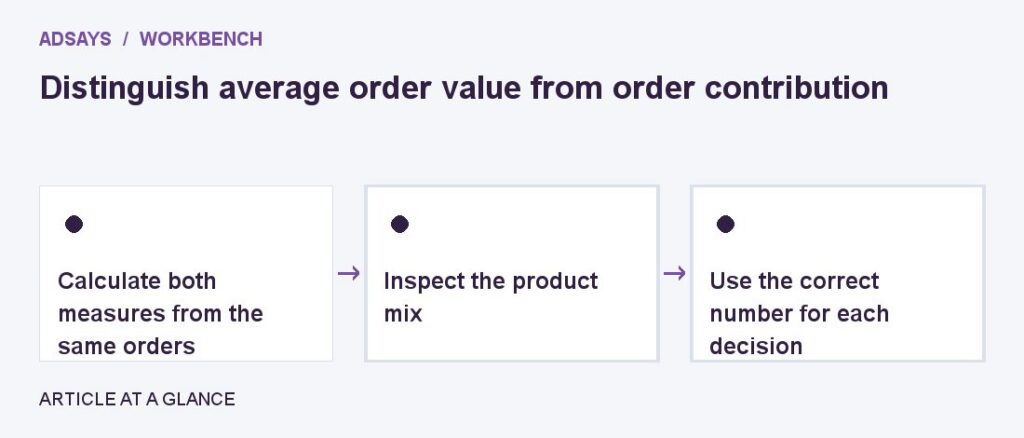
Inspect the product mix
Compare bundles, discounts, fulfillment, and returns. An added accessory can raise order value but also trigger a shipping subsidy. Segment orders before assuming one average applies to every campaign or product line.
Use the correct number for each decision
Use order value to understand buying behavior and contribution to judge acquisition or promotions. Reconcile with settled costs and note estimates for incomplete return windows. Report total contribution beside per-order values because volume can move in the opposite direction.
Try a related tool
Compare revenue per advertising dollar with the return needed to cover ad spend. Enter net revenue and contribution margin before ads.