ROAS and the profit it leaves behind
Turn reported ad revenue into a contribution decision.
The scenario
A store spends $2,000 to generate $8,000 in reported sales. After discounts, returns, product cost, and shipping, its pre-ad contribution margin is 35%.
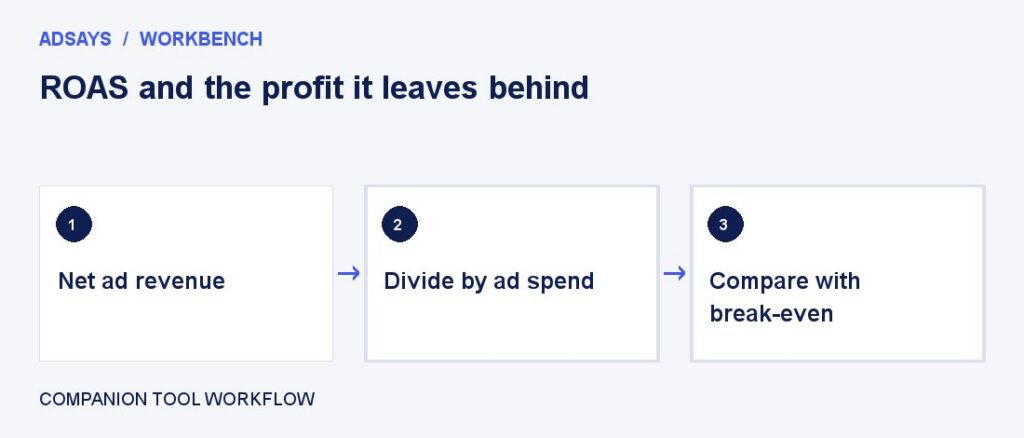
At 4× ROAS, contribution before ads is $2,800. After ads the campaign leaves $800. Break-even ROAS is 1 ÷ 0.35, or 2.86×, assuming the margin holds.
Apply it to your own work
Pull net sales and variable costs by SKU from order records. Recalculate contribution for the specific mix promoted, then compare the next budget tranche with the break-even ratio.
Stress-test the next dollar
Suppose the next $500 brings in $1,350 at the same 35% margin. It contributes $472.50 before ads and loses $27.50 after ads. That tranche can be unprofitable while the campaign still reports a healthy blended ROAS.
For a weekly review, record two rows: the original spend and the additional spend. In each, record settled net revenue, estimated contribution before ads, ad spend, and contribution after ads. Use a controlled comparison where you can; an attribution report by itself cannot show whether the new spend caused the difference.
What to watch for
Platform revenue may include tax or gross orders that are later refunded. Replace it with settled net revenue before making a profit claim.
Put returns on the same clock
Export order ID, net revenue, product cost, and refund date. Assign refunds back to the order cohort when comparing campaigns. If $600 of the reported $8,000 later reverses and your 35% margin still applies, contribution after ads falls from $800 to $590.
Set a reporting cutoff that allows most returns to settle. Keep a preliminary view for daily pacing and a settled view for spending decisions. Record which view appears in the scorecard so a delayed refund does not look like a sudden change in ad efficiency.
Try a related tool
Compare revenue per advertising dollar with the return needed to cover ad spend. Enter net revenue and contribution margin before ads.