Use a conversion maturity table to forecast sales
Estimate pending outcomes without treating a forecast as a count.
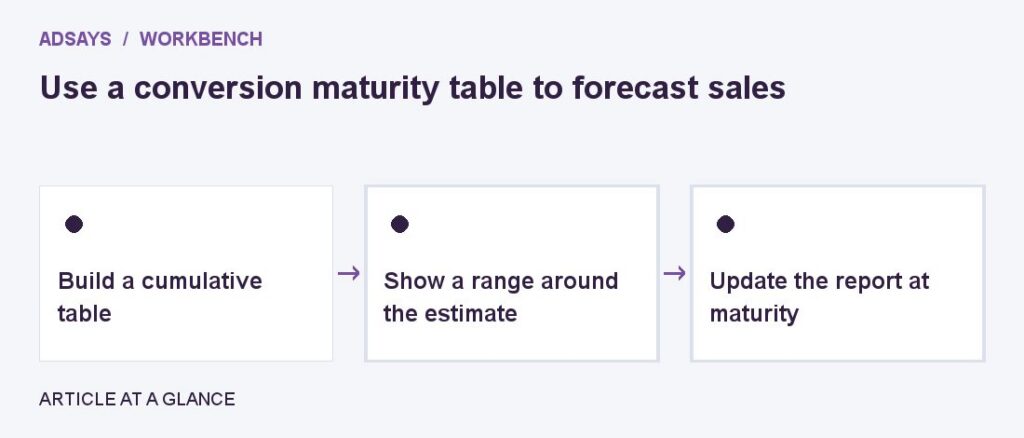
Build a cumulative table
Group leads by acquisition week and count sales visible at ages of seven, 14, and 30 days. Use older cohorts to estimate the share normally recorded by each age. Keep recent cells blank where the window has not elapsed.
Show a range around the estimate
If seven-day outcomes usually represent 60% to 80% of 30-day sales and a recent cohort has 12, a rough range is 15 to 20. Record 12 as observed and the range as an estimate. Use channel-specific history if purchase timing differs.
Update the report at maturity
Replace the forecast with actual results when the review window closes. Keep historical forecast errors to improve future assumptions. If a reporting delay or a new sales process shifts the curve, mark the change and avoid treating older patterns as current evidence.
Try a related tool
Find the share of eligible visits that completed a defined action. Count at most one conversion per visit for this calculation.