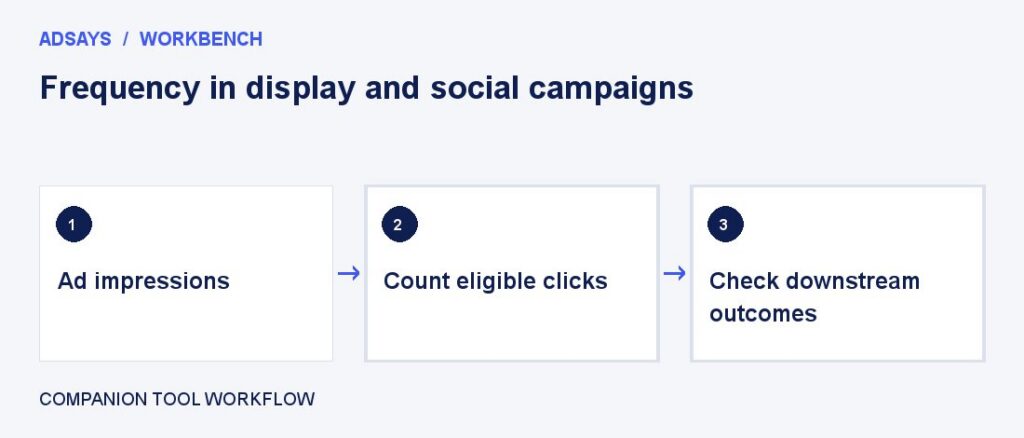
Frequency in display and social campaigns
Read repeated exposure alongside reach and business results.
The scenario
A campaign serves 180,000 impressions to 30,000 people in one week.
Average frequency is six. That average can hide a small group seeing the ad dozens of times, so review the frequency distribution when available.
Apply it to your own work
Compare reach, impressions, qualified actions, and comments by audience and week. Rotate creative or broaden a viable audience if repeat exposure rises while incremental reach stalls.
What to watch for
A different device or platform can count the same person separately. Cross-platform frequency cannot be obtained by averaging the platform numbers.
Check the tail of the exposure distribution
If a platform offers buckets, compare people exposed once, two to four times, and more than four times. Use the breakdown to decide whether a rising average comes from broader repetition or a small heavily exposed group.
Pair the exposure review with qualified response and placement. If frequency rises while new reach and qualified actions flatten, rotate the concept or widen only into audiences you can serve. Record the decision by platform because identities and frequency definitions can differ.
Try a related tool
Measure clicks per impression. Use the same click type, placement scope, and date range across comparisons.